T-SQL Debugging Using Visual Studio .NET
Before describing the Visual Studio .NET T-SQL Debugger, let’s start by discussing its predecessor, the SQL Server T-SQL Debugger. While developers are accustomed to using the SQL Server T-SQL Debugger to debug stored procedures, most do not realize they can debug user-defined functions as well. After all, if you select the user-defined function in the Object Browser and then right click, the Debug option is grayed out.
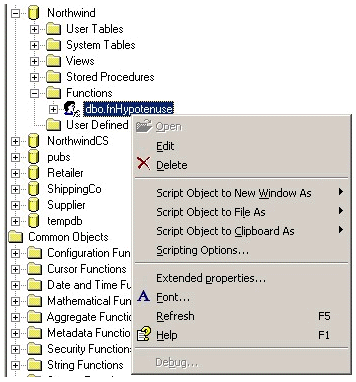
The key to working around this dilemma is to remember what the SQL Server T-SQL Debugger does debug - stored procedures. All you need to do is create a simple “wrapper” stored procedure that calls the user-defined function you want to debug. Debug the stored procedure, and you can step into the user-defined function T-SQL code. If you need to debug a function, creating a wrapper procedure is a small price to pay.
Visual Studio .NET offers a direct debugging interface to user-defined functions. There’s no need to create a wrapper stored procedure when using the T-SQL Debugger from the Visual Studio .NET IDE. Many tasks that formerly required SQL Server tools can be performed directly within the .NET IDE. All of the steps necessary to create a .NET database project, create a user-defined function, and debug the function are shown here. For this article, the local machine runs Windows XP with SQL Server 2000 Developer Edition, service pack 1, and Visual Studio .NET Enterprise Architect, service pack 1. When SQL Server and Visual Studio .NET are installed locally on the same machine, there aren’t any special configuration issues. However, this is not the case for remote debugging , also covered later in this article. The remote server for this demonstration is Windows 2000 with SQL Server 2000 Developer Edition, no service packs.
Local Debugging
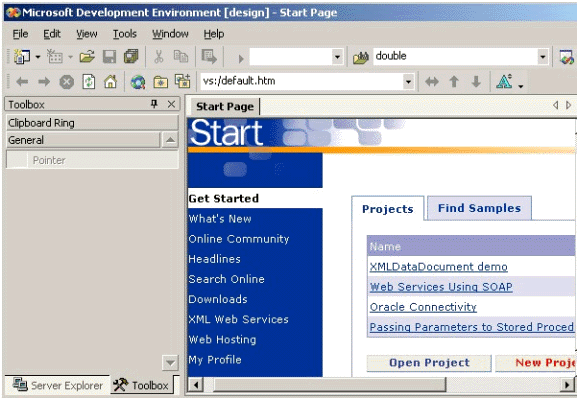
Begin by starting the Visual Studio .NET IDE. On the Start panel, select New Project.
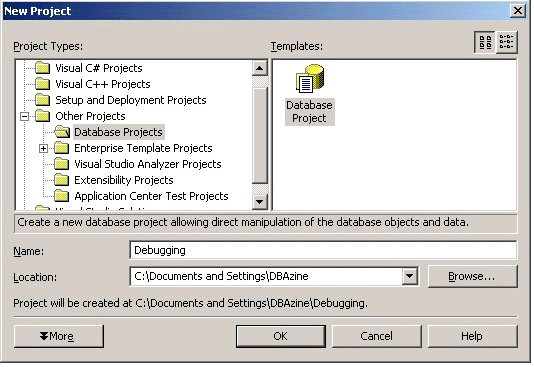
Change to a more descriptive project name such as Debugging.
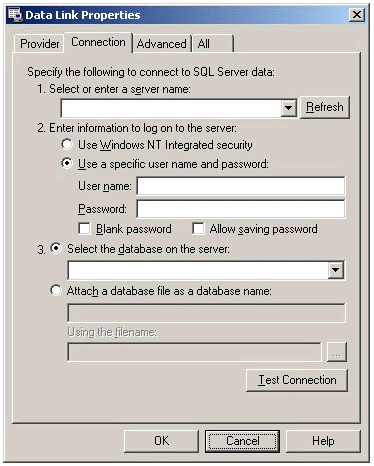
Click OK, which causes Data Link Properties to appear. In this simple exercise, it isn’t necessary to configure anything, so just click Cancel.
Now you are back to the Visual Studio .NET IDE with the Server Explorer showing on the left. If you can’t see the Server Explorer, go to the Menu Bar and select View, then Server Explorer. Expand the tree in the Server Explorer by expanding SQL Servers, then expand Northwind or whatever database you wish to use. Select Functions, right-click, then select New Scalar-Valued function.
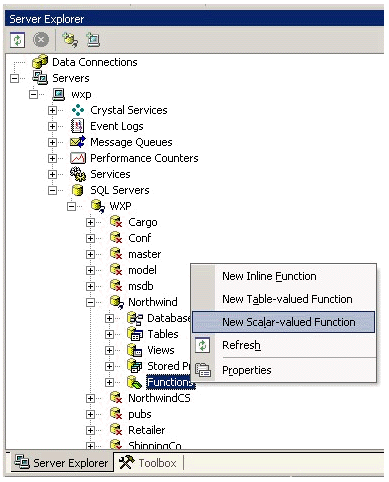
For our example, we will create a function to calculate the hypotenuse of a right triangle using the following code. It is intentionally more lines of code than is necessary so we will have more lines of code to step through.
CREATE FUNCTION dbo.fnHypotenuse
(@side1 float, @side2 float)
RETURNS float
AS
BEGIN
   DECLARE @side1Squared float
   DECLARE @side2Squared float
   DECLARE @hypotenuseSquared float
   DECLARE @hypotenuse float

   SET @side1Squared = @side1 * @side1
   SET @side2Squared = @side2 * @side2
   SET @hypotenuseSquared = @side1Squared + @side2Squared
   SET @hypotenuse = SQRT(@hypotenuseSquared)

   RETURN @hypotenuse
END
To create the function, go to the Menu Bar, select File, and then choose Save Function1 (or whatever default name appears).
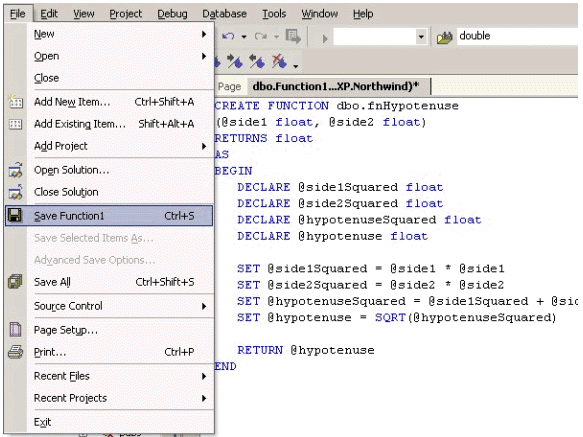
Don’t be misled by the floppy disk icon on the Save Function1 selection. It doesn’t save the function to a file. Instead, it saves it directly to the database. After the function is created, expand the Functions node in Server Explorer, select the function, right-click, then select Step Into Scalar-valued Function. Because our function requires parameters, we are prompted to provide them before continuing. Notice that DEFAULT and NULL are provided as potential parameter values but are not appropriate for this example. For this debugging example, enter the values 3 and 4.
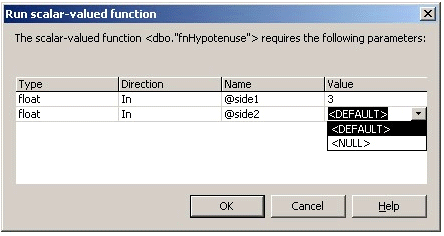
Click OK and then the Debug window appears.
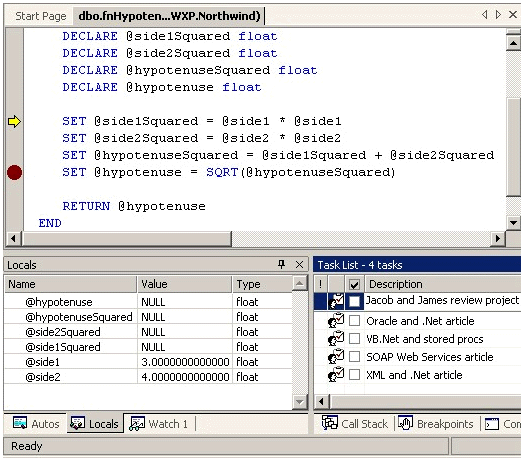
Visual Studio .NET’s T-SQL Debugger is a full featured tool. You can set breakpoints and change the values of variables as you debug much the same as you would when debugging other languages.
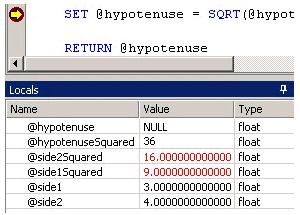
By changing the value of the @hypotenuseSquared value at the breakpoint, the value returned from the function changes accordingly. As you can see, the Visual Studio .NET IDE offers a high degree of functionality with ease of use.
Remote Debugging
Remote debugging in the generic sense uses either TCP/IP or a combination of DCOM and the Machine Debug Manager. TCP/IP is for debugging native C/C++ applications, so it is not relevant to T-SQL debugging. DCOM is required for remote T-SQL debugging. Debugging a function or stored procedure on a remote SQL Server requires special configuration of the remote machine. SQL Server must be running in the context of a named account, not Local System. There are three approaches to installing DCOM on the remote server:
- Install the requisite files manually.
- Install Visual Studio .NET. This requires a license for Visual Studio .NET on the remote server.
- Install only the Visual Studio .NET debugging components.
Minimizing effort and cost seems particularly appealing, so the third method is described. Begin by inserting Disk 1 of Visual Studio .NET. The Enterprise Architect version was used in the writing of this article. Click Remote Components Setup. The Windows Component Update is not necessary if you are only enabling T-SQL Debugging on the remote server.
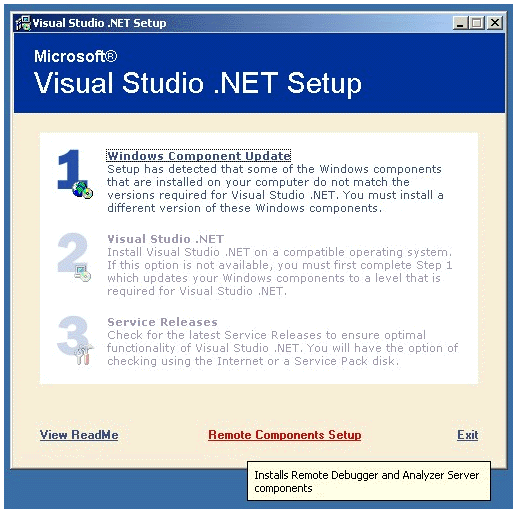
Instructions for installing remote debugging will appear. The instructions appear in a window that includes buttons for starting several different types of installation. Follow the instructions concerning installation of the Windows Installer 2.0. Since the remote machine has only SQL Server 2000 installed and T-SQL debugging is all that is needed, proceed directly to the Install Full button and click it to begin the installation (should take a minute or less).
Once installation of remote debugging is complete, several configuration steps are required. They are fully covered in the Visual Studio .NET documentation under the general topic Remote Debugging Setup. You need to read the documentation carefully to understand the challenges of properly configuring all of the necessary security options to allow remote debugging to work. This section provides an overview of the configuration process and calls attention to key concepts.
The installation of debugging creates a Debugger Users group. You will have to add your Visual Studio .NET username to the Debugger Users group on the remote SQL Server. Additionally, DCOM must be configured. On the remote SQL Server, use the Run command to execute dcomcnfg.exe and then select the Default Security tab. Next, click the Edit Default button.
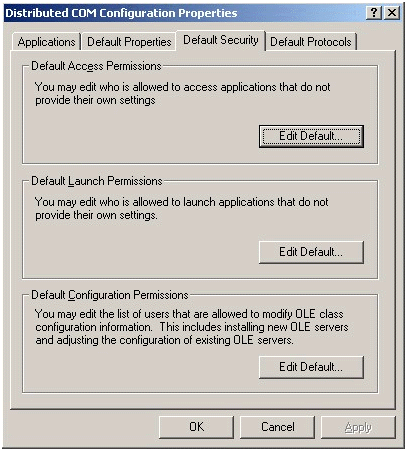
Refer to the Visual Studio .NET documentation under Configuring DCOM for SQL Debugging for more information. Briefly, both your Visual Studio .NET client user (which is now in the SQL Debuggers group on the remote server) and SYSTEM must have access permission for remote debugging to work as shown in the screen capture. (Author’s note: Under SQL Debugging: Security Issues in the Visual Studio .NET documentation, item 2 refers to the SQL Debugger Registry 2 application, which was not found on our Windows 2000 Professional machine named DBAzine. Instead, we set the properties for the sqldbreg application.)

In addition to configuring DCOM, it is necessary to configure the remote SQL Server. Appropriate database permissions must be granted. There must be a SQL Server Login and a database User. The database user must have permissions on the function or procedure to be debugged, as well as execute permission on sp_sdidebug, which is found under Extended Stored Procedures in Master. Failure to grant execute access to sp_sdidebug results in the following error message:
Server: Msg 229, Level 14, State 5, Procedure sp_sdidebug, Line 1
[Microsoft][ODBC SQL Server Driver][SQL Server]EXECUTE permission denied
on object 'sp_sdidebug', database 'master', owner 'dbo'.
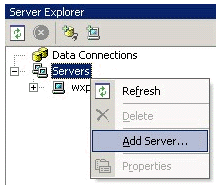
After all of the necessary security and configuration settings have been properly made, the remote server can be added to the list of servers in Server Explorer. Select the Servers node, right click, and then select Add Server. You must provide valid credentials that will authenticate you with the server. Then you must provide valid credentials to authenticate with SQL Server, either by means of integrated security or by providing a SQL Server login and password.
Improper SQL Server configuration will result in the following error:

The remote server DBAzine has a user-defined scalar function named fnHypotenuseRemote. After adding the properly configured DBAzine server, remote debugging is just as simple as local debugging.
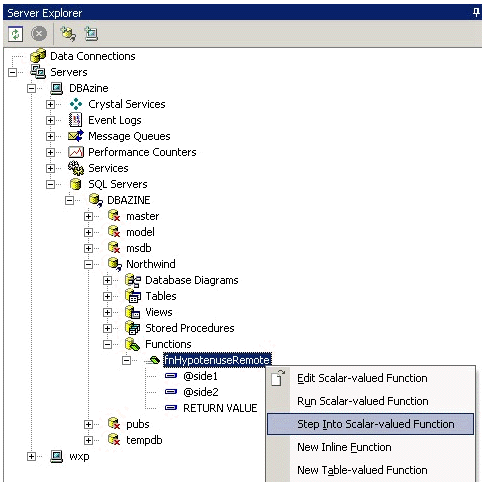
Remote T-SQL debugging is highly effective but not to be taken lightly. It requires careful and knowledgeable configuration of security settings. In some environments, it might require more privileges than corporate security policies allow. For simplicity and security, local debugging is recommended.
Switching from Remote to Local Debugging Using MSDE
Local debugging can be accomplished more easily than many people realize. A full installation of Visual Studio .NET installs MSDE 2000, which is the SQL Server database engine without a license for client tools such as the Enterprise Manager or Query Analyzer. By connecting to your remote database using the SQL Enterprise Manager, you can script your remote database to a file. Run the script on your local MSDE 2000 database, load sufficient data for testing, and then debug your stored procedures locally.
Debugging a Stored Procedure from Code
If you are stepping through code and want to step into a stored procedure instead of stepping over it (which is the default), you must set the project’s properties to allow SQL debugging. In the Solution Explorer, right click on the project and select Properties. On the Property Pages dialog box, select Configuration, then select Debugging. Under Debuggers, set Enable SQL Debugging to True.
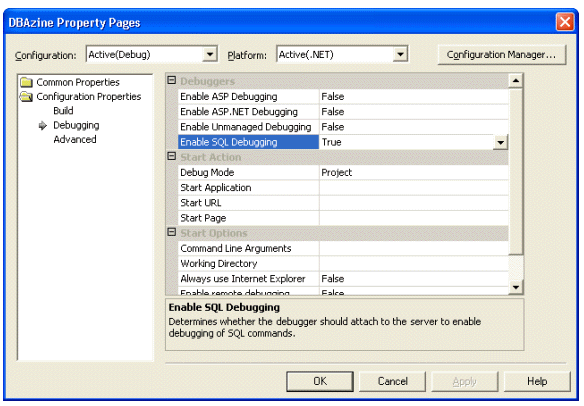
You must use the Server Explorer to set a breakpoint in the stored procedure before running the project in debug mode. You will step into the stored procedure from the .NET language source code from an execute method of a Command object or the Fill method of a DataAdapter object. For more information, see the source code examples in “Calling Stored Procedures from ADO.NET.”
Conclusion
When debugging, it is important to remember that the act of debugging alters how the application maps into memory. This can, in rare instances, cause the application to behave differently than when it is not being debugged, possibly even causing the bug to not appear during the debugging process. This is sometimes jokingly referred to as a Heisenbug, a reference to the Heisenburg uncertainty principle in quantum physics. The .NET Framework supports multithreaded applications, which bring their own challenges to debugging. The complexity of a multithreaded application can result in mandelbugs (a reference to the Mandelbrot set), bugs whose causes are so obscure that they appear random. Repeatable bugs are known as Bohr bugs, named after quantum physicist Niels Bohr.
As you can see, Visual Studio .NET’s debugging features, coupled with the Server Explorer, provide a powerful, convenient debugging interface. “Wrapper” stored procedures can now be “tossed out” with the advent of .NET’s easy to use IDE and the direct debugging of user-defined functions.
--
John Paul Cook is a database and systems architect in Houston, Texas. His primary focus is helping large enterprise customers succeed with SQL Server, Oracle, and the .NET framework.
Contributors : John Paul Cook
Last modified 2005-04-18 01:16 PM

thanks