
 Access Path Identification - Part V
Introduction
Readers of this blog know that 10G Grid Control provides a wealth of tools
that facilitate database and SQL tuning. I have written a couple of dozen blogs
that focus on the various advisors and utilities we can use to assist us in
the tuning process.
But 9I's Oracle Enterprise Manager (OEM) is no slouch either when it comes to tuning and diagnostic tools. Since the focus of this blog has been to cover Oracle 10G, I won't be reviewing all of the 9I tools we can use to assist us in the tuning process. But this recent series of blogs focuses on the various tools that we can use to view access path information and there are tools that 9I OEM provides that are definitely worth discussing. And lets face it, there are LOTS of Oracle9I databases out there.
9I OEM allows us to log in with a repository or in stand-alone mode. Most of the tuning and diagnostic tools require the use of a repository which is a set of tables stored in a database. If you install the Oracle9I software in a windows environment, you'll find a 9I Oracle Enterprise Manager Configuration Assistant contained in your Oracle menus. When you run the configuration assistant, Oracle will prompt you for database connection information. Once the repository is configured, you will have the ability to run the advanced diagnostic tools that Oracle9I OEM provides. After the initial configuration is complete, you'll need to run the Navigator to add databases into the Oracle9I OEM infrastructure.
Sessions Panel
After the databases are added using the Navigator drop down, each time you
activate 9I OEM, the first panel shown will be a database listing. You select
the database you want to administer or monitor and then activate the various
tools and utilities you want to use.
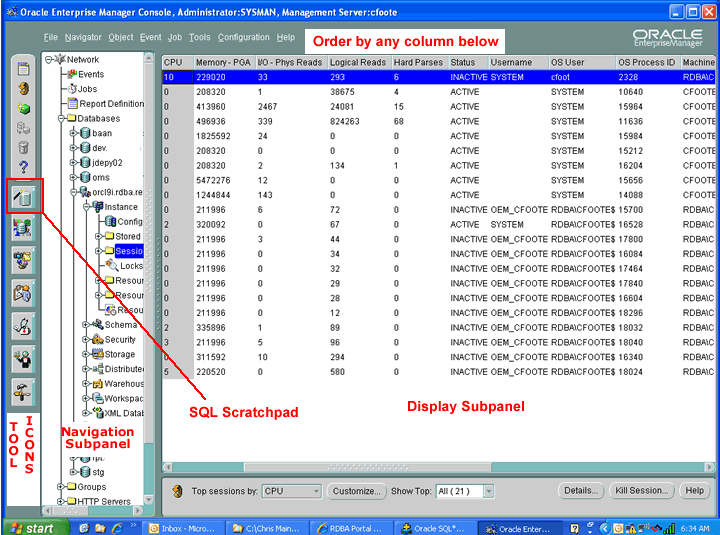
Let's take a look at this first screenshot. On the far left of the screen, you'll see a listing of icons we can use to activate the various toolsets provided by 9I OEM. The display screen itself is split into two subpanels. The subpanel on the left allows me to navigate to a database and then drill down to view and administer configuration settings, schema definitions, security, locking, etc..
Please note that this screen shows that I have already activated the Sessions display panel. I use this panel a lot when I am reviewing SQL performance for a 9I database. Look at the column headings at the top of the screen. It allows users to sort the sessions by the column headings. The columns provide information on program name, machine name, OS User and process ID, which allows users to easily identify specific sessions.
The columns also provide key performance indicators. We can sort sessions by CPU, memory and physical and logical I/O. These columns make it easy for us to identify the top resource consumers. We are then able to drill down into that session to determine what SQL statement the session is executing and how well it is performing.
Drilling Down
to View Specific Session Information
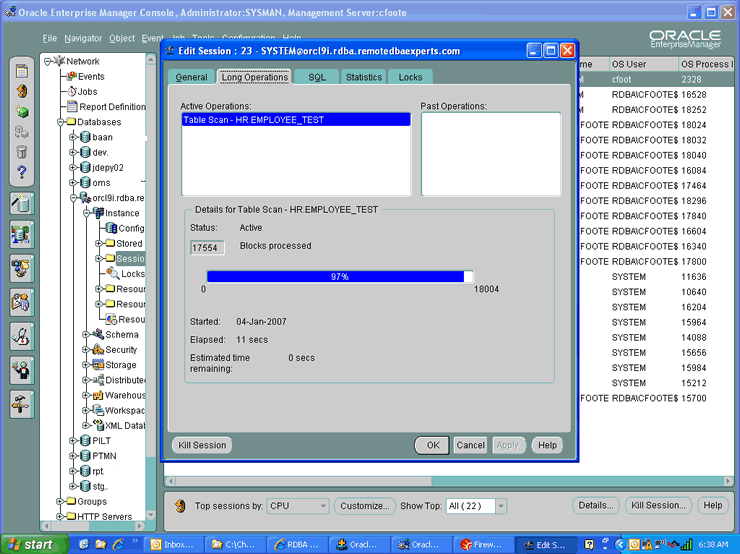
If I double-click on a specific session, 9I OEM displays the session drill
down panels. I am able to select from general information, long operations (if
available), the SQL statement currently being executed (blank if the session
is not currently running a statement), performance statistics and locking information.
Here's a screenshot
of long operations information for a session in my database. The long operations
display tells me how many blocks have been accessed and how many more blocks
Oracle predicts must be read before that individual operation is complete. This
display shows that I have almost completed a table scan on the HR.EMPLOYEE_TEST
table.
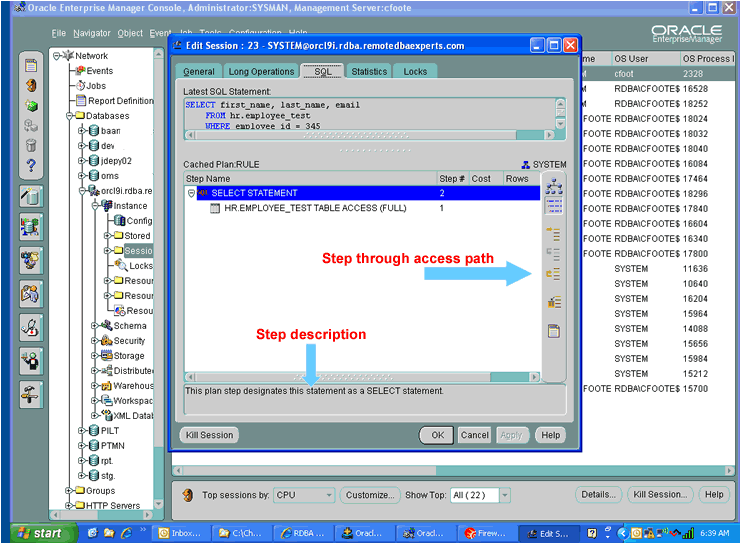
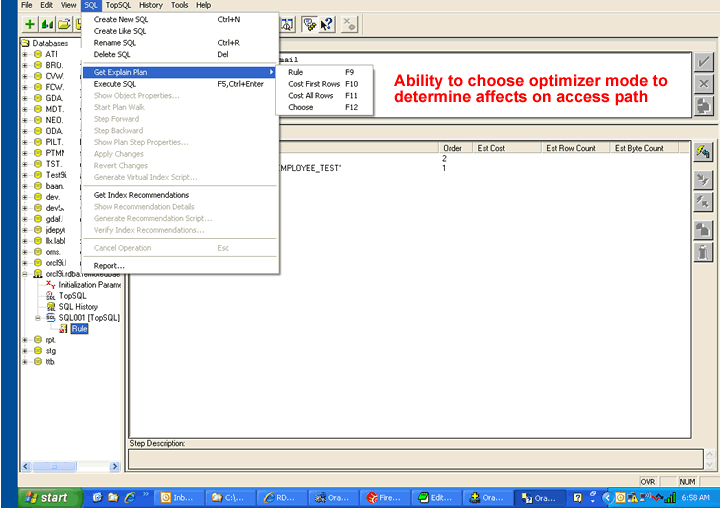
The SQL tab at the top of this panel allows me to display the current statement being executed by the session. The panel also displays the access path that Oracle is predicting the statement is taking. Remember that we learned in previous blogs that because of certain conditions (like bind peeking for one), that the access path can change during execution.
The panel allows me to choose from either a text or graphical description of the access path. In this case, I have chosen to view the graphical display of the access path. The cool feature of this panel is that the icons on the right hand side of the screen allow me to step through the access path. As we step through the access path, Oracle will display a description of the step being performed at the bottom of the panel. Not only does it allow us to more quickly identify how the query is accessing the data, but it also provides us with a quick education on the access paths themselves. If you aren't an expert in Oracle access paths, this is a quick way for you to start your education.
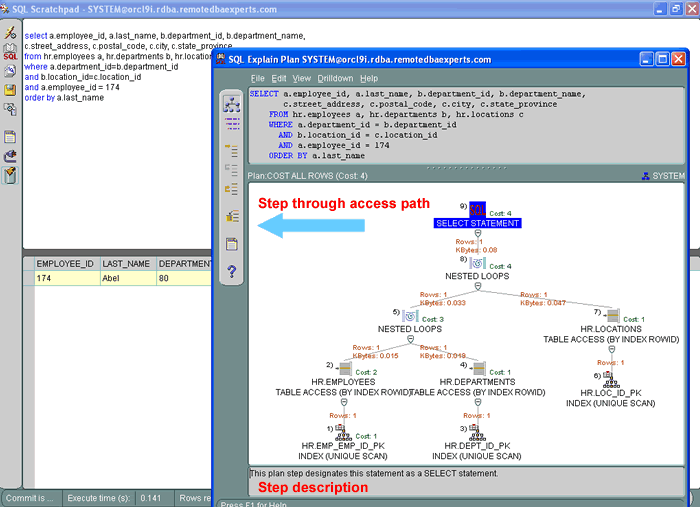
SQL Scratchpad
Let's close this subpanel and navigate back to the main 9I OEM screen. When
I click on the top
tool icon, 9I OEM will respond by displaying a horizontal menu listing of
additional icons. The icon on the far right will be for the SQL Scratchpad utility.
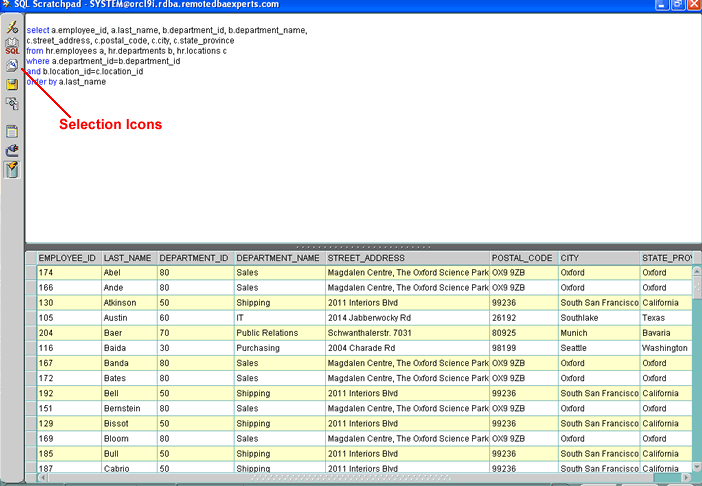
If I click on the far right icon,9I OEM responds by displaying SQL
Scratchpad. Scratchpad allows me to run SQL statements, edit them and then
save them to a folder. For this discussion, we are most interested in Scratchpad's
graphical access path display capabilities.
If I click on the icon that looks like an open book, 9I OEM responds by displaying the predicted access path the query will use when it executes. Like its session drilldown counterpart, SQL Scratchpad allows me to view the access path in text or graphical mode and allows me to step through the individual steps. Once again, the tool provides us with an easy way to educate ourselves in Oracle access paths.
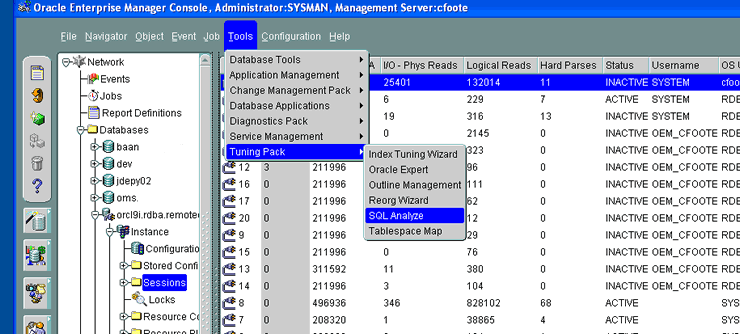
SQL Analyze
Another tool that 9I OEM provides to view access path information is SQL
Analyze. SQL Analyze is only available if you have purchased the tuning pack
option for 9I OEM. This screenshot
shows me navigating through 9I OEM's menus to activate SQL Analyze.
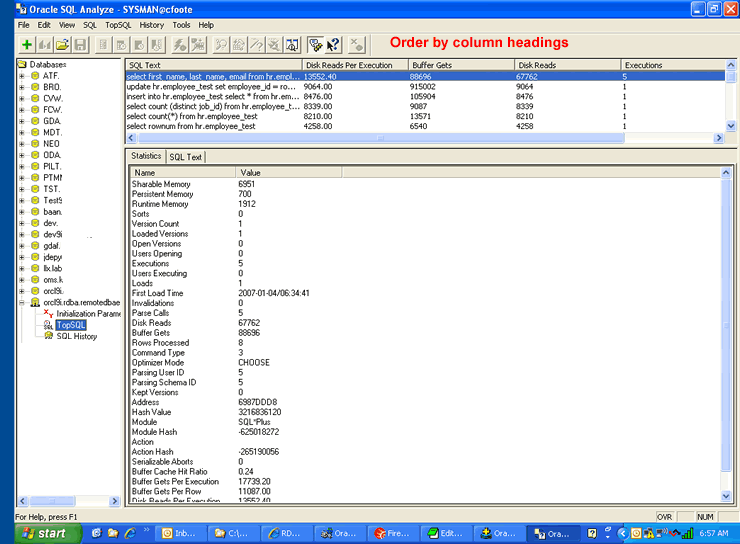
When you activate SQL Analyze, the first step the utility performs is to display a listing of all of the top resource consuming SQL statements that are contained in the library cache. If the statement has been flushed from cache, you won't find it in this display.
The tool lists all of the databases on the left side of the panel that you worked with in the past. As you can see, I am a pretty active user of SQL Analyze.
I can double-click
on any statement in the top SQL listing to view its access path information.
I can also use the menu system at the top of the screen to create a blank worksheet
for new queries that I can enter manually. I found the statement I wanted from
the listing and double-clicked on it to activate
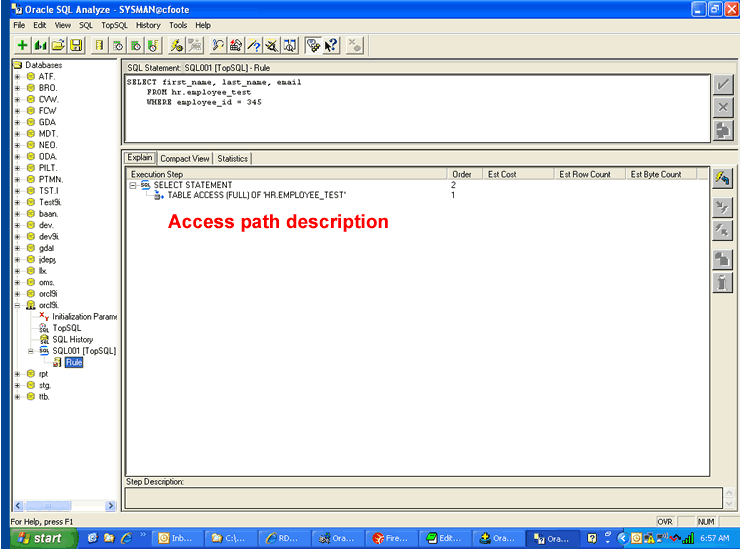
the SQL tuning panel.
The panel displays the SQL statement, and like our other utilities, allows us
to step through the access path the query is taking. I can click on the SQL
drop down menu at the top of the screen to ask Oracle to explain the statement
using the various optimizer modes that are available.
SQL Analyze
Tuning Tools
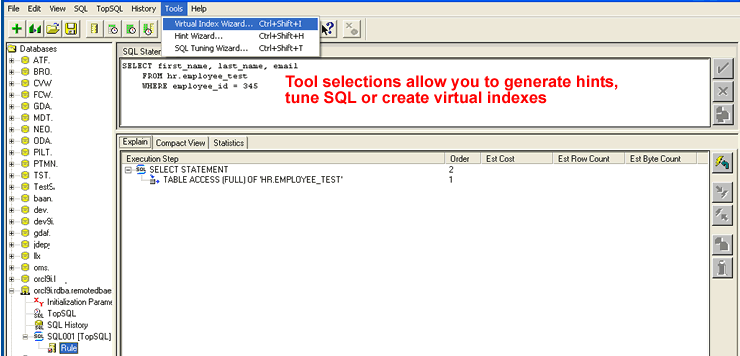
SQL Analyze provide us with tools that facilitate the SQL tuning process. The
tools
menu at the top of the screen allows me to choose from three different wizards.
We'll review the Virtual Index Wizard in just a moment. The Hint Wizard allows
us to choose hints from a drop-down menu system, while the SQL Tuning Wizard
activates an intelligent advisor that provides us with SQL tuning recommendations.
Once you have run the SQL Tuning Wizard a few times, it's pretty easy to see
that it was the precursor to some of the more advanced utilities that are now
available in Oracle 10G.
Virtual Index
Wizard
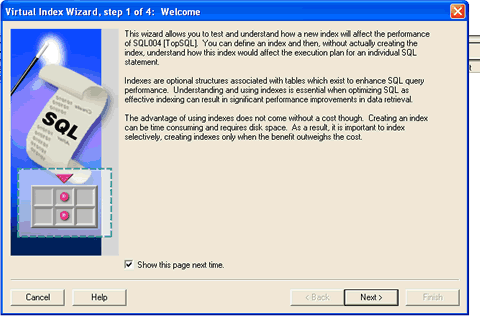
The Virtual Index Wizard allows me to create virtual indexes on tables
that our query is accessing. The key word in that last sentence is "virtual".
Oracle does not permanently create the index. The intent of the wizard is to
allow users to determine the potential performance impact a new index would
have on the statement being analyzed. It is then up to the user to permanently
create the index.
If I click on the Virtual Index Wizard menu selection, 9I OEM responds by displaying
the Virtual
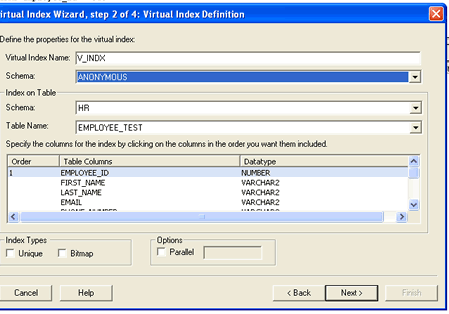
Index Wizard introduction panel. When I click on Next, the wizard displays
a panel that allows
me to select the columns for my virtual index. Clicking next again displays
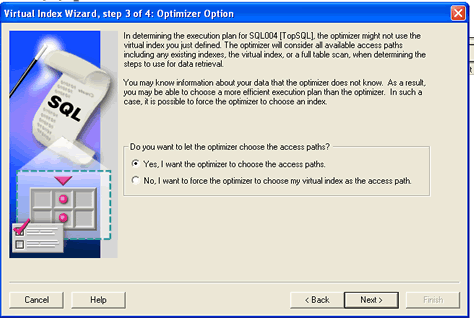
a panel that allows me to attempt to force Oracle to use the new index or
allow it to choose the new index on its own. My personal preference is to allow
Oracle to choose the index on its own without providing any additional prodding.
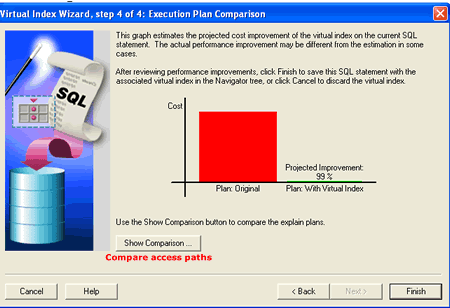
Clicking Next again displays the projected cost improvement the new index will have on the statement being analyzed. I used a full table scan on a rather large table as an example. Based on the display, we can be pretty sure that the new index will have a positive affect on our statement's performance. The last panel also displays a button that allows us to view the before and after access paths.
The Virtual Index Wizard does a fairly good job of estimating the impact that new indexes will have on a SQL statement. It is an excellent tool to use when you are starting your tuning education as well as evaluating access paths in Oracle 9I databases.
I hope you enjoyed this blog on Oracle 9I access path identification. I think that after reading this blog, you'll agree that Oracle9I OEM provides users with a host of utilities to facilitate the access path identification and SQL statement tuning processes.
Next Up
We'll take a look at the various tools in 10G Grid Control that we can use to
display access path information.
Thanks for Reading,
Chris Foot
Oracle Ace 

